By TRH World Desk
The catastrophic Nepal-Tibet flood has acquired a new dimension as preliminary terrain analysis suggests that the flood surge may have reached extraordinary heights in confined sections of the Himalayan river system.
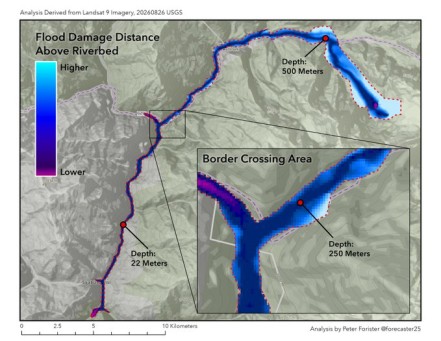
New Delhi, August 28, 2026 — Geographer Peter Forister, analysing Landsat 9 imagery and SRTM terrain data, has estimated that the flood surge may have risen as much as 500 metres (about 1,500 feet) above the river channel in some locations, with an estimated depth of 80-100 metres at the border crossing.
Forister, however, cautioned that the figures require careful interpretation. “Terrain analysis in the Nepal flood channel shows the flood surge may have been 500 METERS high (1500 ft) in places, and 80 – 100m deep at the border crossing. Preliminary analysis using Landsat 9 images and SRTM Terrain data with a rough flood extent. Data here is representative of the distance water reached above the river channel, which can be a rough estimation of depth. However, water velocity (especially around tight corners) can run up a slope a long way in excess of true depth,” he wrote on X, while sharing satellite images of the unfolding of the Himalayan tragedy.
He added: “Along the upper reaches of the flood channel, actual floodwater depth of ~100m (300 ft) seems likely.”
The distinction is important. A 500-metre run-up or inundation elevation above the river channel is not necessarily equivalent to a 500-metre vertical wall of water. In steep Himalayan terrain, exceptionally fast-moving water, mud, boulders and ice can climb valley walls and slopes, particularly when forced through narrow bends and constrictions.
Yet even with that caveat, the preliminary estimate illustrates the extraordinary scale of the event.
‘As Tall as the Empire State Building’
The possibility of a surge reaching hundreds of metres above the normal river channel has attracted the attention of atmospheric scientists.
Jeff Berardelli, Chief Meteorologist and Climate Specialist, who holds a BS in Atmospheric Sciences from Cornell University, wrote on X: “1500 ft high flood surge? If true, that’s gargantuan. It’s as tall as the Empire State Building. I would not be surprised. In 1958 in Lituya Bay, Alaska a massive landslide caused a huge tsunami wave and massive 1700 ft splash-up in the narrow Bay. So narrow channels can really funnel water very high.”
Berardelli’s comparison is significant because the 1958 Lituya Bay event demonstrated how a gigantic landslide entering a confined body of water can generate an extraordinary vertical run-up.
The Nepal event was not the same physical phenomenon as the Lituya Bay tsunami. But the comparison highlights an important principle: confined mountainous terrain can convert enormous horizontal momentum into spectacular vertical run-up.
In the Nepal-Tibet disaster, the available evidence increasingly points towards a cascading process involving glacier collapse, an ice-and-rock avalanche, debris flow and catastrophic flooding through narrow Himalayan valleys.
What Happened in the Himalayas?
The U.S. Geological Survey’s preliminary assessment says the August 26 disaster was likely triggered by a glacial collapse in the Langtang region, generating a debris flow and flood that travelled nearly 100 kilometres through populated areas along the Bhote Koshi and Trishuli river systems.
USGS analysis of seismic waves indicates that the source was a glaciated mountain cliff on the north side of Langtang Lirung, an approximately 7,200-metre mountain. The collapse generated seismic energy equivalent to a magnitude 5.2 earthquake.
That finding has also changed the interpretation of the seismic event.
Initial reports had suggested that an earthquake might have triggered a landslide. But the USGS assessment indicates that the seismic signal itself was generated by the collapse of glacial rock and ice followed by the debris flow.
Reuters’ satellite and terrain reconstruction shows a sequence in which the lower portion of the glacier broke away, crashed onto the valley floor and generated an avalanche of ice and rock before the debris flow entered the river system.
The scale of the cascading event was immense.
According to the Reuters reconstruction, the debris flow travelled at approximately 50 metres per second, or about 180 kmph, and extended for more than 20 kilometres. The resulting floodwaters then travelled more than 100 kilometres downstream, descending more than 4,500 metres in elevation.
That combination —extreme altitude, steep gradients, confined valleys and enormous quantities of ice, rock, mud and water — helps explain why the disaster developed with such devastating speed.
The Roof of the World Is Melting — And Downstream Nations Are Running Out of Time to Prepare
Why the 500-Metre Figure Needs a Caveat
The most spectacular number emerging from preliminary analysis is also the one that requires the greatest caution.
Forister’s analysis uses Landsat 9 imagery and SRTM terrain data to reconstruct the approximate flood extent. If water or debris reached far up a slope, the vertical difference between the normal river channel and the observed inundation boundary can be used as a rough indicator.
But that does not mean the entire flood column was 500 metres deep.
In steep terrain, fast-moving water can climb a slope because of momentum. At bends, constrictions and abrupt changes in valley geometry, the flow can also produce substantial run-up.
That is precisely why Forister himself qualifies the estimate, noting that water velocity “can run up a slope a long way in excess of true depth.”
The more defensible interpretation, therefore, is that the terrain evidence may indicate a maximum inundation/run-up elevation approaching 500 metres above parts of the river channel, while actual water depth in some upper-channel sections may have approached approximately 100 metres.
Independent evidence nevertheless confirms that the debris-flow footprint was extraordinarily large. Reuters’ mapping based on Planet Labs and OpenStreetMap data shows buildings inside the debris-flow area at places including Syapru Besi, Betrawati and Devighat.
A Glacier Collapse Becomes a Larger Warning
The event also raises a broader question about the stability of Himalayan glaciers and mountain slopes.
Atmospheric scientist Paul Roundy, Professor of Atmospheric Science, wrote: “Glacier collapse events are worse when the glacier is bigger. That’s a big confound in history, because nearly all alpine glaciers in steep places eventually become unstable and fall. There are some really famous catastrophes that developed this way.”
Roundy’s observation puts the Nepal disaster into a wider geomorphological context.
A large glacier situated above a steep mountain valley represents a potentially enormous reservoir of ice. If part of that glacier collapses, the initial failure can trigger secondary processes — including rock avalanches, debris flows, river blockages and sudden releases of impounded water.
The disaster therefore should not be understood simply as a conventional flash flood.
It increasingly resembles a cascade of interconnected mountain hazards.
Nepal-Tibet Flood Mystery: Satellite Images Point to Massive Glacier Collapse
Climate Change: Risk Multiplier, Not Yet a Single-Cause Explanation
Scientists are also examining whether climate change contributed to the instability that preceded the collapse.
Reuters reported that Simon Cox, chief scientist of the Mountains to Sea programme at Earth Sciences New Zealand, said climate change is generating conditions that can destabilise high-mountain rock and ice. He cautioned, however, against treating climate change as the sole immediate trigger.
Warming can reduce the stabilising role of ice, increase meltwater and alter freeze-thaw cycles. These processes can weaken mountain slopes and potentially increase the likelihood of large collapses in vulnerable locations.
This is consistent with Roundy’s broader point: glaciers in steep alpine environments can naturally become unstable. The scientific challenge is determining why this particular collapse occurred at this particular moment, and whether warming altered the probability or magnitude of the failure.
Saying that climate change “caused” the flood would go beyond the evidence currently available. Saying that a warming Himalayan environment may be altering the background risk of cascading ice-rock disasters is a much more defensible proposition.
The Human Toll Continues to Rise
The scale of the humanitarian disaster has also become clearer.
The latest available figures reported on August 28 put the death toll in Nepal at 389, with three additional deaths confirmed on the Tibet side, taking the combined toll to 392. Nepal’s latest disaster-management tally listed 910 people missing or out of contact, including 288 Indian citizens. Chinese authorities separately reported 558 people missing in Tibet.
India’s 288 missing or uncontactable citizens included 73 people working at the Trishuli-1 hydropower project. More than 200 Indians were also reported stranded on the Tibetan side.
Rescue operations have been severely hampered because roads and bridges were destroyed, while electricity and communications were disrupted and several settlements remain isolated. Nepal’s Prime Minister Balendra Shah said 573 people had been rescued through 69 air sorties on Thursday, with additional helicopters kept on standby.
Nepal Flood Disaster: What Planet Satellite Images Reveal About the Trigger
The Next Danger May Not Be Over
One of the most worrying aspects of the disaster is that the first flood may not be the final hazard.
Scientists and authorities are monitoring newly formed or potentially unstable water bodies and debris blockages upstream. A temporary blockage can create a lake behind accumulated ice, rock and mud. If that barrier fails, a second outburst can send another destructive surge downstream.
The Kathmandu Post reported that scientists are still reconstructing how the ice-and-rock avalanche triggered the flood, while a newly formed barrier lake has raised concerns about further flooding.
This is the characteristic danger of cascading Himalayan hazards: the initial collapse can alter the river system itself, creating new threats downstream hours or even days later.
A Disaster That Changes the Way Himalayan Floods Must Be Read
The preliminary 500-metre figure should therefore be treated as a scientific hypothesis requiring further field validation, rather than as a confirmed measurement of a 1,500-foot-high water wall.
But the underlying message is already clear.
The Nepal-Tibet disaster was not simply an unusually large rainfall-driven flood. Evidence now points towards an exceptionally powerful sequence beginning with the collapse of a glacier and underlying mountain material, followed by an ice-and-rock avalanche, debris flow and a high-energy flood through narrow Himalayan valleys.
Peter Forister’s terrain analysis offers one indication of just how high the resulting flow may have climbed in places. Jeff Berardelli’s comparison with the extraordinary Lituya Bay run-up illustrates the physical possibility of extreme vertical run-up in confined terrain. Paul Roundy’s warning about the instability of large alpine glaciers provides the broader geological context.
Together, the three observations point towards a sobering conclusion: in the high Himalayas, the most dangerous floods may be those that begin not with rain, but with the sudden collapse of the mountain itself.
As satellite analysis continues, scientists are now trying to establish the precise volume of ice and rock that collapsed, the geometry of the valley at different points, the quantity of water displaced or mobilised, and the actual depth and velocity of the resulting flow.
Those measurements will determine whether the 500-metre estimate survives scientific scrutiny.
But there is little doubt that the August 26 disaster ranks among the most extraordinary examples of a glacier-to-avalanche-to-debris-flow-to-flood cascade seen in the Himalayas in recent years.
Nepal Floods: Was a Massive Glacier Collapse Behind the Deadly Debris Flood?
Follow The Raisina Hills on WhatsApp, Instagram, YouTube, Facebook, and LinkedIn