23 countries have higher proportion of poor in rural areas than India
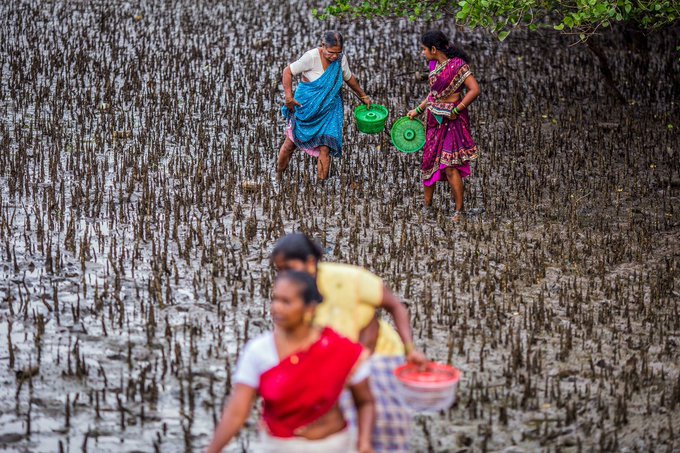
Photo credit Twitter UNDP India
By Pradeep Kumar Panda
Bhubaneswar, March 6: A recent UNDP Report has highlighted India’s relative success in bringing down multidimensional poverty quite significantly during the period 2005-06 to 2019-21. The Report indicated that India was successful in bringing 415 million people above the poverty line during this period.
According to the definitions used by the UN, the poverty headcount ratio in the multidimensional measurement of poverty was reduced from 55.1 per cent in 2005-06 to 16.4 per cent in 2019-21. It was also recognized that the Sustainable Development Goal (SDG) target 1.2 – “reducing at least by half the proportion of men, women and children of all ages living in poverty in all its dimensions according to national definitions by 2030” is within reach.
It was observed that the fastest reduction in poverty happened for the poorest states and groups (children, lower castes and those living in rural areas), although the data do not reflect post- pandemic changes. Simulations in 2020 suggested that the COVID-19 pandemic had set the progress in reducing the Multidimensional Poverty Index (MPI) values back by between 3 to 10 years.
More recent data indicate that the setback at the global level is likely to be on the higher end of this range. The conventional measurement of poverty related to a single dimension of purchasing power of households generally captured by income. These measures led to summary indices such as the headcount ratio, the poverty gap ratio and the FGT index.
In subsequent literature, these measures have been supplemented by considering multi-dimensional aspects of poverty. These initiatives were undertaken by institutions such as the United Nations Development Programme (UNDP) and the Oxford Poverty and Human Development Initiative (OPHI). They provided a platform for cross-country comparison of poverty levels and reduction in these over time.
The 2010 study compared 104 countries covering 5.2 billion people. The latest study published in 2022 compared poverty reduction achievements across 111 countries covering 6.1 billion people. These studies were based on three dimensions namely, health, education, and living standards.
In turn, these were captured by 10 indicators closely aligned to the SDGs developed by the UNDP. Equal weights are assigned to the three broad dimensions. For health and education, there are two indicators each, which are given a weight of 1/6 each. With regards to the dimension pertaining to living standards, there are six indicators, and these have been individually given a weight of 1/18.
For each person, a deprivation score is first created by adding up the weights of each indicator the person is deprived in, thus reflecting the percentage of a person’s weighted deprivations. An MPI poor is defined as someone who experiences one-third of the weighted deprivations or more, severely poor as someone with half or more, and vulnerable as someone with greater than 20 per cent but less than one-third.
The global MPI begins by constructing a deprivation profile for each household and the person in it. For example, a household and all people living in it are deprived if a) any child is stunted or any child or adult for whom data are available is underweight, b) if at least one child died in the past five years, c) if any school-aged child is not attending school up to the age at which he or she would have completed class 8 or no household member has completed six years of schooling, or d) if the household lacks (i) access to electricity, (ii) source of drinking water within a 30-minute walk round trip, (iii) sanitation facility that is not shared, (iv) non-solid cooking fuel, (v) durable housing materials, and (vi) basic assets such as a radio, animal cart, phone, television or bicycle.
Information relating to these criteria is aggregated into a summary index of poverty called MPI, which also captures the intensity of poverty faced by the households. An aggregate MPI is calculated by multiplying the incidence of poverty (H) and the average intensity of poverty (A). More specifically, H is the proportion of the population that is multi-dimensionally poor, while A is the average proportion of dimensions in which poor people are deprived. So, MPI = H x A, reflecting both the share of people in poverty and the degree to which they are deprived.
A higher value of MPI indicates greater incidence of poverty. In 2005-06, 55.1 per cent (H) of India’s population was deprived in at least one-third of the 10 weighted indicators. These are counted as MPI poor. The headcount ratio had fallen to 27.7 per cent in 2015-16 resulting in a reduction in the number of MPI poor people by 275 million.
In 2019-21, the headcount ratio fell further to 16.4 per cent. Correspondingly, the number of MPI poor fell by 140 million over the period 2015-16 to 2019-21. The intensity of poverty amongst the multi-dimensionally poor reduced to 44 per cent during 2015-16 from 51.3 per cent in 2005-06.
In 2019-21, there was a further fall to 42 per cent. As a result, the MPI has fallen by 0.214 points over the period 2005-06 to 2019-21, a decline of more than 75 per cent. In 2019-21, with reference to the total MPI value of 6.9, the largest contribution came from deprivation with reference to living standards, followed by health and education.
In the latest report (2022), while the total MPI value is given, its decomposition for the earlier years was not provided. One of the key findings of the UNDP report is that for the poorest states and groups (children, lower castes and those living in rural areas), poverty reduced the fastest in absolute terms, although the data do not reflect post-pandemic changes.
The incidence of poverty fell from 36.6 per cent in 2015-2016 to 21.2 per cent in 2019-2021 in rural areas and from nine per cent to 5.5 per cent in urban areas. Rural disparities are comparatively pronounced. Ninety per cent of India’s poor people live in rural areas and 10 per cent in urban areas.
In absolute numbers, 205 million of the nearly 229 million poor people live in rural areas. Only 23 countries among those covered have a higher proportion of poor people living in rural areas as compared to India. (to be concluded…)